A MarketTrends Special Report by Colin Cieszynski, Market Analyst, CMC Markets
Following the ECB revealing its plans for the year, Colin Cieszynski assesses how this could affect the performance of gold and the expectations for its future.
Key Factors in ECB Stimulus Impact
Within the report Colin discusses:
- ECB’s latest plans for the year including cuts to lending rates and actions by the central bank to manage money supply
- How in recent years the pricing of gold has been affected by its relationship with the USD
- How we have seen a shift in relationships between gold and the USD to the EUR
- The expectations for gold in the future and how ECB’s policy could impact this
On Thursday June 5th, after over 18 months of steadily removing emergency liquidity from its financial system, the ECB made a sharp U-turn announcing a series of stimulus plans through the end of the year. These included a cut in lending rates to almost zero and forcing banks to pay to part their cash at the central bank; the weekly bond sterilization program that had tied up a significant amount of its money supply, €400 billion in new targeted LTRO loans to come in September and December 2014. In addition, the ECB indicated that it is looking into buying asset backed securities and possible QE.
This major turn in monetary policy exceeded street expectations and sparked an immediate rally in gold which may have signalled a major turning point for the yellow metal after nearly three years of declines.
Gold’s Historical Role as Safe Haven
Gold as a store of value

Colin Cieszynski
For centuries, gold has been seen as defensive currency, a store of value in turbulent times and a hedge against inflation in paper money. In recent decades, pricing in gold (the premier hard asset) has been driven by its relationship with USD (the world’s premier leading paper currency). Since the early 1970s, gold has rallied during times of political or economic uncertainty or during times of inflation and weakened when paper money rebounded.
An example of this relationship has been in the resurgence of gold since the turn of the century as USD retreated. Most specifically the first two QE programs ignited major rallies in gold as big increases in the supply of US Dollars depressed the value of the paper currency.
Table One: Performance of Gold during US QE programs
| QE1 | Nov 2008-March 2010 | 36.3% |
| QE2 | Nov 2010-June 2011 | 8.3% |
| QE3 | Sept 2012 – present (May 2014 to date) | 29.5% |
Source: CMC Markets
Relative to the first two programs, gold performance since the start of QE3 has been truly dismal. It also indicates that gold’s relationship with paper currencies has changed dramatically in recent years.
Gold's Evolving Relationship With Currencies
Trading in Gold relative to the Euro
What has become increasingly clear in the last few years is that since the start of this decade, gold’s primary relationship in trading has changed from USD to EUR. The European sovereign debt crisis sparked major new flows of capital from Europe into gold that has changed its main trading drivers.
The chart below shows that the advances of gold generally tracked expansion of the money supply in the US and Europe from the early 2000s through to the summer of 2012. At that point, the ECB and the Fed diverged in their approach to money supply. The ECB ran a stealth taper where it shrank its balance sheet by €1 trillion over 18 months as banks paid back their borrowings under the first LTRO program. At the same time, the Fed expanded its balance sheet dramatically through the QE3 program.
Over the same time period, instead of rallying as it did during the US QE1 and QE2, gold sold off, indicating that it had started to take its cue more from the shrinking money supply and reductions in political and financial risks from Europe, than from the Fed.
Chart One: Relationship between central bank assets and currency prices January 2000-present
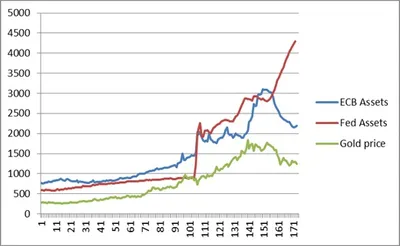
Source: CMC Markets, Bloomberg L.P.
Implications of ECB Policy Shift for Gold
What could the ECB policy change mean for gold?
Between September of 2012 and March of 2014, the ECB reduced its asset base by about €1 trillion. The sterilization and targeted LTRO moves announced in early June may restore substantial part of this.
The end of weekly sterilization frees up €165 billion immediately, with two tranches of targeted LTROs slated to add another €400 billion by the end of the year. This means that we could see the ECB restore €565 billion of the €1 trillionish it took away or about a 56% restoration. This does not count any additional funds from new ABS purchase or other QE type programs.
If gold continues to follow its recent trend of tracking the size of the ECB balance sheet, it could potentially stage a 56% retracement of its losses over the last few years in the coming months. Considering that 50%-62% Fibonacci retracements are common in markets around the world, a rebound of this magnitude does not appear to be out of the question.
Chart Two: Gold price in USD 2011-present
Technical Picture: Gold Price Trends
The chart below shows that following its peak in late 2011, gold sold off dramatically over the next two years. In the last year, however, gold has been consolidating and base building in a $1,180 to $1,400 trading channel.
Near the end of 2013, gold completed a double bottom near $1,185 which coincided with a positive RSI divergence to suggest that the previous downtrend is coming to an end.
At this point it would take a break through $1,400 to signal the start of a new recovery trend, but if gold does track the re-expansion of the ECB’s balance sheet, a 50% to 62% retracement of the previous downtrend suggests the $1,555 to $1.640 zone could potentially be probed over time.
 Source: CMC Markets