Adyen records almost twice as many mobile payments in the UK than the global average
Retail uniquely sees both tablets and smartphones steal share from desktops; other sectors show smartphones dominating the mobile channel
Android platform experiencing tremendous growth but iOS still king of mobile web transactions
Adyen Mobile Payments Index Q2 Overview
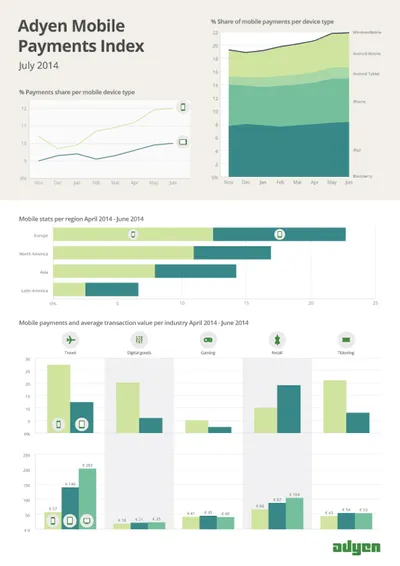
Adyen, the global provider of international and omni-channel payment solutions, today announced findings from its latest global Mobile Payments Index covering the period of April through June 2014. During this period, on average mobile web payments accounted for almost 22% of all transactions on Adyen’s network worldwide. This represents a 9% increase over Q1 and a 33% increase over June 2013. Looking specifically at the UK, mobile payments stand at 39%, significantly higher than the global average and demonstrating growth of more than 5% over Q1.
ADYEN GLOBAL MOBILE PAYMENTS INDEX Q214: UK AHEAD OF REST OF WORLD, DRIVEN BY RETAIL SECTOR
UK Retail Sector Leads Mobile Growth
Nearly 72% of all Adyen merchants are processing payments over the mobile web, up from 70% in Q1. Adyen is seeing its UK Retail customers in particular focus on driving conversion in the increasingly popular mobile channel, which is contributing to the high volume of mobile transactions occurring in the region. The global average mobile web share of transactions for the Retail vertical is just over 29% for Q2, an increase of 3.2 percentage points from Q1 and 2.9 percentage points up from Q4 2013.
Q2 Mobile Web Share of Transactions by Industry:
· Travel: PC 60.42%; Mobile 39.58% (Phone 27.24%; Tablet 12.34%)
- Ticketing: PC 70.86%; Mobile 29.14% (Phone 21.06%; Tablet 8.08%)
· Retail: PC 70.94%; Mobile 29.06% (Phone 10.01%; Tablet 19.04%)
- Digital Goods: PC 73.97%; Mobile 26.03% (Phone 20.12%; Tablet 5.91%)
· Gaming: PC 92.6%; Mobile 7.38% (Phone 5.04%; Tablet 2.33%)
Tablet Usage Surges Among Retail Shoppers
Retail Shoppers Prefer Tablets for Mobile Commerce
The Index shows Retail shoppers in particular to have an appetite for larger screen devices, with Retail standing out as the only vertical to see the volume of mobile payment transactions grow from Q1 to Q2 across both tablets and smartphones, up by 2.52 and 0.68 percentage points respectively. In the other verticals tracked by the Index, tablets as well as desktop computers lost share to smartphones in Q2. The exception is Gaming, where all mobile web transactions declined, primarily due to a rise in in-app purchases. Adyen’s Mobile Payment Index focuses exclusively on web-based mobile payments and does not track in-app payments.
Q2 Change in Percentage Points from Q1:
- Travel: Phone +5.26%; Tablet -0.14%
- Digital Goods: Phone +3.25%; Tablet -1.6%
- Gaming: Phone -2.16%; Tablet -0.33%
- Retail: Phone +0.68%; Tablet +2.52%
- Ticketing: Phone +5.33%; Tablet -0.01%
“In the UK market, our retail customers lead the way in recognizing the importance of the mobile channel,” said Myles Dawson, UK Country Manager at Adyen. “In particular, they are looking to capitalize on the rise in preference for large-screen devices, which are more conducive to browsing and buying articles based on their design and individual features, such as clothes or electronics. Mobile conversions are front of mind, and we’re seeing customers innovate around how they integrate mobile with their broader e-commerce strategy, including in-store, and streamline the experience across all channels and platforms.”
Retail Mobile Shoppers Drive Higher Spend
Retail Shoppers Spend More on Mobiles
The Retail sector uniquely experienced growth in transaction value from both smartphone and tablet users in Q2, up by more than 18.2% and 6.8% respectively. Gaming showed an increase of more than 5.25% in average purchase size from smartphone users, and Ticketing saw an 11.5% increase from tablet users.
Q2 Average Transaction Value by Industry/Device (vs. Q1)
- Travel: PC €201.61 (- €1.52); Phone €56.76 (- €0.58); Tablet €139.64 (- €5.12)
- Digital Goods: PC €22.63 (- €1.75); Mobile €18.02 (- €2.66); Tablet €21.17 (- €3.99)
- Gaming: PC €40.20 (+ €0.60); Mobile €41.38 (+ €2.09); Tablet €44.63 (- €2.94)
- Retail: PC €103.99 (+ €0.13); Mobile €65.83 (+ €10.14); Tablet €87.31 (+ €5.58)
- Ticketing: PC €52.87 (+ €5.47); Mobile €43.34 (- €0.27); Tablet €53.69 (+ €5.54)
Android Adoption Rising in Mobile Commerce
Android Gaining Ground on iOS
The Index revealed that the use of Android devices in mobile commerce is growing at a tremendous rate – particularly Android smartphones – but for now they do not pose a threat to iOS-based phones and tablets. In Q2, 8.3% of all transactions came from an iPad (an increase of 6.5% over Q1 and a 12.2% increase over last year) and the iPhone represented 6.6 % (6.5% over Q1 and 24% over last year). However, Android’s quarterly growth was more than double that of iOS, and its year-over-year growth dwarfed iOS. Android tablets represented 1.7% of all payment transactions, growing 13.25% over Q1 and 90% growth over last year. Android smartphones generated 5.2% of all transactions, growing 15.25% over Q1 and 104% over last year. The UK is seeing Windows Phone transactions creeping up from 0.2% in January 2014 to a steady 0.3% from February onwards, compared to a global average of 0.1% for the operating system.
Regional Variation
In the UK in June, smartphones represented 24.1% of all transactions and tablets 14.8%, in both cases growing by 1 percentage point over the Q1 average percentage.
Regional Comparison of Mobile Transactions
Europe more generally leads the world in m-commerce transactions, with 22.7% of all transactions originating from a mobile device (12.4% phone; 10.3% tablet). This represents a nearly 40% increase from June 2013, when mobile represented 16.3% of total transactions.
In North America, mobile represented 16.9% of all transactions (10.9% phone; 6% tablet), a 48% increase over last year’s 11.4%. Asian mobile transactions accounted for 14.2% of all transactions (7.9% phone; 6.3% tablet), up 20% from 11.8% one year ago. Latin America, at 6.6% (up nearly 75% from 3.8% last year), was the only region to show a continued increase in tablet transactions over smartphones (2.5% phone; 4.1% tablet).
About the Adyen Global Mobile Payments Index
The Adyen Global Mobile Payments Index is based on Adyen global payment transaction data. This Index has been created to track the rapid evolution of mobile as a sales channel and provide insight into mobile web payment trends for different devices, market sectors and geographies. Adyen’s Mobile Payment Index focuses exclusively on web-based mobile payments and does not track in-app payments. Adyen processes payments for more than 3,500 medium, large and enterprise-sized organizations mainly operating multi-national businesses. The company processed more than USD 14 billion in payments transactions in 2013, of which USD 2.2 billion were mobile transactions.