Kuwait Market Performance and Losses in 2011
Blame Adverse Local & Regional Circumstances aided by Europe Debt Crisis as Investors lost KWD 6 Billion in the year The year 2011 did not end with good tidings for the Kuwaiti market contrary to 2010, where the market heavyweights put up a great show of optimism for investors. The KSE weighted Index, the best performer in the GCC group by inflating 25.51% in 2010, reported a red-marked performance in the year whereas the general Price Index continued its south-bound journey for 4th consecutive year, since the eruption of 2008 crisis. Several important events took places which have affected the market sentiments. Political uproar, global crisis and stagnant business activities led markets to move like a snail for most part of the year. As a result, markets ended the year down by 16%, a performance that failed to enthuse investors both at home as well as abroad. Surprisingly, in 2011, both the market indices, the Price & Weighted, ended the year with almost identical losses, as the former dipped by 16.41% and the latter slipped by 16.22%, symbolizing that market remained in balance by adjusting losses of heavy weights with gains in small and mid cap stocks or vice versa.
On contrary, the Islamic Universe of Kuwaiti market outperformed both the conventional peers by reporting a single digit loss of 9.05% during the year. More interestingly, the GCC emerged as a unique category, where the markets remained least volatile despite of multiple news inflow from Euro Zone, UK, US and merging Asia. The developed and emerging category, reported an average volatility of around 25% whereas the GCC averaged just 13% during the same period. Though a lower volatility may be termed as a good indicator favoring the GCC economies, yet, we cannot deny the fact that such lower number also points towards a lower turnout in the markets, reflecting an inactive trading or illiquidity for investors, which is far more dangerous from fresh investment point of view. Adding on, though, the GCC markets also ended on the red line, yet they outperformed the other two categories by reporting lower losses. A continuity of weakening investment in Europe and US, specifically related to some sectors in UAE elicited pains to them. On the global part, most of the economies, especially in Euro Zone, were able to garner all the attention in recent months and posed a big but meaningful question: whether they should go bankrupt or bailout? Either way things were too patchy and undesirable, due to daring devil consequences standing next to any such step. Governments, walking on a double edge sword were- left with no option except to select bad out of worse. Global slowdown led to lower demand for metals which led to a huge fall in the metal prices in 2011.
In brief, the Year ‘11, casted a dark shadow on all the market categories, sufficiently supported by faulty economic decisions of few but key super economic powers.
1) Lower wages resulted in lower consumer spending
2) Speeding inflation in emerging markets due to drying out supplies
3) Inclining oil supplies impacting corporate cost factor
4) Discount rate mismatch between developed and emerging markets
5) Bankruptcy verge for various countries of Euro Zone and likes, remained dominating factors for 2011, which stalled any black magic number to appear on the screen for the year.
Best and Worst Performing Sectors
Closer home, on a sector wise basis, the Insurance sector (that comprises of mere 7 stocks) emerged as a clear winner, mainly bullied by the sector heavy weight First Takaful which helped overall sector to cross the FY 2010 mark. Even though other sectors like Banking, Services and Food outperformed the Price Index, nevertheless they still delivered negative returns overall.
The biggest loser for the year was the infamous Investment Sector (if Non Kuwaiti is excluded). The sector hammered both the ways as on one side they witnessed an erosion in their investments, in addition to weakening trading and investment activity income and other side, the debt burden and absence of new credit line, took a huge toll on the stock prices in the sector. Government’s inaction, policy paralysis and drying new credits to business activities, continued to haunt the non-oil economic growth in 2011.
KSE Performance– A Rather Depressing as Investors Refrain from Investing Q1-2011: After ending the 2010 on a flat note (though the KSE Weighted Index posted a robust gain of 25%, topmost among the GCC), the KSE market looked promising and began its journey for 2011 in an upward bias, which remained quite short lived. The weighted index, which was up by around 2.5% by January 24 suddenly came under the grip of bounding instability factors, mainly led by political unrest across the Arab regime. Tunisia, Egypt, Yemen, Bahrain and few other GCC countries weighed down heavily on the markets. Unrest in Egypt was the most crucial and dominating factor which spread depression waves across the region, as of which investors looked in a hurry to sell stocks to safeguard their cash. In this turmoil, those stocks which were having business ties in the form of investments and trade plunged to their years low, thus guided overall market to a downward path. The spurted downtrend continued till March, and changed its way opposite when better than expected FY 2011 earnings and cash rewards were announced by the listed companies. The course was almost sailing through, when Tsunami in Japan stroked and once again put the market in reverse mode as investors remained concerned for the estimated trade loss with Japan, on the account of natural calamity. By 1Q, the market
Q2-2011: However, during the 2Q-11, the market moved away its focus from Arab unrest and remained fully focused upon the Euro Zone crisis. Initially, the market reacted cautiously on each sovereign move, however post the announcement of austerity measures by Greek government, investors rushed to trading floors and began fresh buying specially to those beaten down stocks. As a result, by April end, the market jumped to 7% on m-o-m basis and everything looked settling down. The happy journey could not last long once again, due to unhealthy developments in local political circle which were further aided by political deadlock between the parliament and lawmakers, which in turn took its toll on the Kuwaiti market and lost all its previous gains of April and ended the 2Q with a modest loss of 0.98%. Q3-2011: Investors seemed in a confused mode and adopted a cautious approach on the latest detrimental developments like a bleak US economic outlook, Greece Debt crisis, weakening Euro, slowdown of the GDP growth, lending restrictions and infusions of S&P’s downgrades. Impeding market losses, lower dividends payout, surging inflation further worsened market conditions for investor’s community across the globe. In the Middle East, the market bleeding was aided by non-stop social unrest with political tussles and Kuwait remained no exception.
The burning issue of corruption and increasing employee strikes of various ministries, unnerved local investors. Amid all these global and local developments, the KSE Weighted Index and Muthanna Weighted Islamic Index reported a quarterly loss of 5.87% and 3.28% respectively. Q4-2011: Once again the roller coaster ride for the KSE Price Index set-off as investors returned to the market, embarking an upward journey, however the expedition was clearly marked with the presence of high volatility. Investors seemed more in a mode of “hit and run” than long term investing, considering the floating economic aspects across the globe and as a result, each rally was immediately followed by a plunge. Geo-political tension, continuity of Arab spring, weak 9M earnings and debt dilemma in Europe aided by weak GDP projections by IMF weighed down on the market sentiments as of which all the gains, accumulated in the beginning of 4Q were outshined by non-stop losing streaks witnessed by end of the year. On the sector front, two key sectors, the Banking and Services which shared around 70% of total market cap as of December 31, 2011, ended the year on negative note, as of which overall market also slipped by around 20% in total market cap. On the KSE Islamic front, where the Islamic Banking shared around 70% of total universe market cap also dipped in total market cap by around 8.5% mainly led by KIB , KFIN and Boubyan Bank which eroded by 25%, 16% and 6.3% respectively.
(Detailed Sector Analysis is on Page 4)
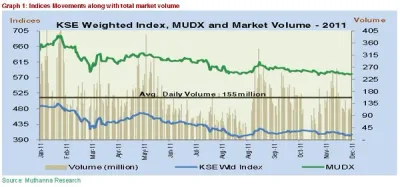
In totality, the KSE Islamic Universe outperformed its conventional index (KSE Price Index) as it witnessed a confined dip of 9% and closed at 580.23, reporting a loss of 57.76 points over 2010. The general “KSE Price Index” could not see any support from its two heavy weights sectors (Banking & Services) and finished off the year with a double digit loss of 16.41% during the same period. However, it is important to note that despite of better performance, the MUDX reported higher volatility compared to KSE PI. The KSE PI, maintained a narrow range band of movements during 2011, same like in 2010, and thus reported lower volatility of 8.7% (2010: 9.4%) whereas MUDX’s reported a volatility of 14.2% (2010: 13.44%) during the same period. In 2011, the general index touched a peak of 6,999.40 (05 January 2011) and closed the year with a drop of around 17% from its peak whereas the MUDX was in bit better shape as it reported a yearly high of 690.54 (25 January 2011) and closed the year with around 16% down from its peak. The lowest for the Price Index was 5,764.30 (21 August 2011) and for MUDX it was 577.49 (21 November 2011) and for both the indices the closing was not far from their lowest levels, envisaging the bearish mode of the market.
Detailed 2011 Kuwait Stock Market Analysis
Market Analysis – 2011
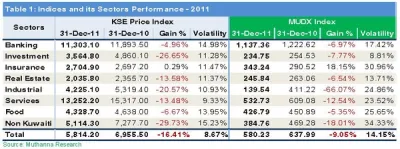
Market movements were dominated by red marks as overall market fell by around 17%, mainly guided by 156 stocks (72.8% of the total 214 listed stocks) which reported a drop in their market prices in comparison to 59% of stocks declined a year ago. In 2011, just 44 stocks (20.5%) advanced during the year, which is far less than the previous year. The Index looked under the firm grip of adverse developments both on the local fronts as well as on global fronts and as of these, seven out of the nominated eight sectors reported a drop in the year. The only exception was the Insurance sector index which reported a marginal 0.29% gain during the year. Major indices like Banking Index (Bankex) was down by 4.96%; Investment index witnessed a significant decline of 26.65%;
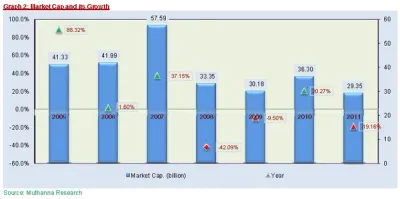
services
index was down by 13.48%; while the Real Estate index was down by 13.58% during 2011. In comparison to the KSE price index, the MUDX Islamic index though negative fared better than the conventional index; as it recorded a 9.05% decline during 2011. In this category too, Insurance was the only sector registering 18.15% gains; while the Industrial sector index was the top loser as it slipped by 66% on y-o-y basis. On the market capitalization side, the KSE market cap stood at KWD 29.34 billion, by the end of December 2011, down by KWD 208 million from a year ago, meaning that it smeared off all the gains made during 2010 when its total market cap was jumped up by 20.27%. The decline was seen across the board as all major sectors lost their steam except of insurance, courtesy to First Takaful, which alone guided the sector on the black marks. The market heavyweight sector, the Banking, which was sharing 44% of total market cap by the year end, saw an erosion of 11.04% in its market cap; while Services (sharing 25.6%) was down by 29.2% in the year, thus pulling down overall market performance. Investment sector (contributing 7.3%) was reiterated as the top loser for 2011, as it lost 30.52% of its Year 2010 market cap during the year, which was the highest in all categories. A further drill down on individual sectors, clears the clouds and depicts that the respective sector heavyweights were the actual reasons for the fall in the market, despite of smart gains concluded by small and mid cap stocks for the year. In case of Banking sector, with the exception of Ahli United Bank (BKME) which added 25.7% gain in market cap all other counters reported declines. Even the sector bellwether like National Bank of Kuwait (NBK) sharing 34.1% of the sector market cap (by year end) reported a 14.4% drop; Islamic biggie Kuwait Finance House (KFH) also lost 16.2% of its market cap from the level of 2010. Mirroring the banking performance, Service sector key stock – Mobile Telecommunication Co. (Zain) which constituted 51.2% of the sector market cap, witnessed a significant deflation of 40.8% in its total market capitalization in 2011.
Among the gainers Mabanee Co which ranked 18th in terms of market cap last year, added 18.3% in its market cap during 2010 and moved up five places to reach at the 13th position by 2011. Similarly; Boubyan Petrochemicals Co which ranked 23rd in 2010, added 10.2% in its market cap (if cash dividends are added back) and jumped up to 19th notch, thus marking entry into top 20 stocks of the exchange.
Top Performance for Year 2011 – Based on Market Capitalization:
This year, in our report, apart from our regular yearly inputs for investors in order to gauge market movements, we are inserting another valuable analysis for our investors, aimed to add further value to our report. The methodology is to divide the whole market into 3 categories, according to their contribution to total market capitalization. Saying so, we have categorized yearly stock performance in a bid to better understand the market signals.
The stocks are put into three major categories, in a “Descending Order in terms of Market Cap”:
I. Large-Caps (Stocks contributing 50% of total Market Cap);
II. Mid-Caps (Stocks contributing the next 25%);
III. Small –Caps (Stocks contributing the bottom 25%);
The initiative was to catalog stocks to identify their true role, for investors and which acted as genuine market movers for the KSE. The grouping provides us the following two key aspects –
a) How the market cap movements of the top brass, guide overall market direction
b) Performance of mid and small cap stocks, especially of outperformers and losers, which made them, eyecatchers for investors.
Large Cap, Mid Cap, and Small Cap Stock Analysis
Large Caps: Of the total 214 listed stocks on the exchange, the Large Cap category, of just 7 stocks (equals to 3.27% of total listing) shared 51.12% (= KWD 15 billion) of the total KSE market cap at the end of Year. The group in totality reported a significant erosion of 22% of its last year market capitalization (as shown in table below) and witnessed only one gainer, NMTC, for the year. The large caps which are characterized as operationally strong; market leaders in their respective sector and tagged as value growth companies, in general reported weak earnings by 9M-2011, and as a result, they took the heat of meltdown. Forex losses, lower growth in operating business income in addition to provisions in case of banks, were key concerns which marked red session for these heavy weights in the year. NBK the biggest lender of Kuwait, reported a marginal increase of 0.4% in its net profits for the period ended September 2011, while it recorded a hefty provision to the tune of KWD 34.7 million during the same period as against KWD 7.1 million, a year ago. Zain, the market leader and top spot company on the KSE, reported 2.15% decline in its operating revenue while its bottom line declined by 6.1%, mainly bumped by foreign exchange losses over the same period.
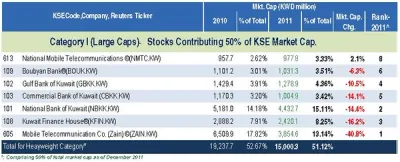
On the performer side, the second largest national mobile operator, NMTC, was lone in the category, to add a meager 2.1% in its market cap as the company reported a super profit of KWD 321.69 million for the first nine months of 2011. (By September 2010: Net Profit was KWD 45.69 million). However, a closer analysis reveals the operator reported a onetime revaluation gain of KWD 278.02 million (non-cash gains) during the same period. If adjusted, the actual net profit for the period stood at KWD 43.67 million which is 4.42% lower than 9M-2010.
—–
Mid Caps: The mid cap category, arranged to mark another 25% of total KSE market cap under the range of 51% to 75%, endorsed only 19 companies (8.87% of 214 listing) by the end of year. The group reported a fall of 11.8% in its total market cap from the level of 2010, as its’ total market cap stood at KWD 7.96 billion, declined by KWD 1,067.3 million in the year. Despite this drop, surprisingly, this category which constituted 24.72% of total KSE Market Cap in 2010 increased its share to 27.1% of total KSE market cap by 2011; thanks to 22% deflation of large cap stocks, providing mid cap stocks to increase their share in total market. Of the total 19 companies only 4 companies advanced by adding market value while others ended on the losing streak.
Analyzing the 9M financials for these stocks, the top gainers were on no different side, if compared to the dull performance of large cap stocks, but low pricing level in 2010 aided by lower reporting losses than expectations, one-time extraordinary gains and squeezing provisions were few but key reasons which helped these stocks to become performers of the year.
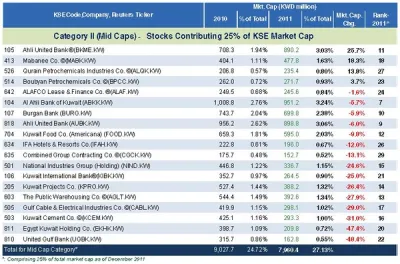
Ahli United Bank was the top performer in the matrix, as it grew by a hefty 25.7% in the year. The bullish journey of the lender was completely guided by its smart net profits, which saw a healthy growth of 29.86% in 9M-2011, as compared to a year ago. The growth was fueled by a 48.7% decline in provisions; else its top line shrank by 5.3% during the same period. Mabanee was second in the matrix, which added 18.3% in its last year market cap and undoubtedly, a strong business model has kept Mabanee elevated in all rough and tough times. By the end of 2011, Mabanee continued to carry its 1st position in the KSE Real Estate sector, by market cap criterion. Further, Qurain Petrochemicals Industries stood 3rd, by reporting a gain of 13.8% as the stock was again bullied by its smart profits for 9M-2011. The petrochemical operator, reported a net profit of KWD 20.45 million for its 9M- 2011 compared to a loss of KWD 1.58 million, a year ago. The profit was mainly steered by hefty dividend income, better results from associates and one-time gain of KWD 3.8 million, from the sale of financial assets. Small Caps: The small caps, is the largest group on the KSE floor, constituting of 188 stocks or to say 87.8% of total listings. However, this group, constituted mere 21.7% of total market cap, thus having the least impact on overall market direction. By the end of 2011, the group’s total market stood at KWD 6.384 billion down by 22.69% as compared to 2010 level. Of the total 188 companies, only 39 reported gains in their market cap while remaining registered
a decline. In the gainers matrix, Jazeera Airways was the top gainer by reporting a humongous growth of 266.9% in 2011, purely driven by its healthy business operations. The airline operator posted a turnaround in its bottom line by reporting a net profit of KWD 9.25 million during 9M-2011 compared to net loss of KWD 4.8 million a year ago.
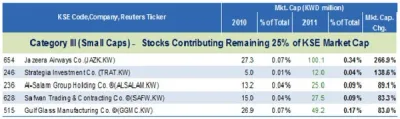
Increase in passenger traffic across the GCC region and strategic acquisition of an Aircraft Leasing company (Sahaab Aircraft Leasing Co.) during December 2010 resulted in 39.8% increase in revenues for the regional Low Cost Carrier (LCC). The stock price was at KWD 0.122 in the beginning of 2011, but ended the year at KWD 0.460 thus giving a full opportunity to rejoice to its shareholders.
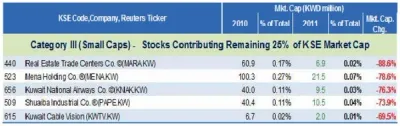
Among the losers, Real Estate Trade Centers Co. lost 88.6% of its market cap followed by Mena Holding Co which lost 78.6% in its market cap in the year. The top losers in this category also occupied the top losers position in the the KSE universe as well. Real Estate Trade Centers counter was hammered as the company reported losses during the 9M-2011, while Mena Holding, the Sharia compliant real estate and property investment firm, was firmly beaten down due to its strong link to Egypt which is witnessing a huge turmoil on political front as well as on economic front too. The company has already filed for a bankruptcy by the end of year 2011 which has been rejected by the Kuwaiti court, as per latest status.
Trading Volumes, Values, and Deals in 2011
Trading Parameters– 2011
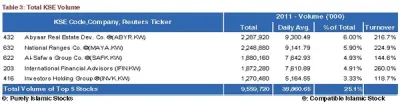
Volume: The total market volume during 2011 stood at 38.34 billion shares compared to 74.69 billion shares last year with decline in volumes across all sectors. Investment sector the largest contributor in terms of volumes (contributing 28.1%) declined by more than 50% during the year; whereas Service sector (contributing 27.6%) another large contributor witnessed a decline in volumes to the tune of 42.3% during the same period. Real Estate sector (contributing 24%) saw 9.12 billion shares traded during 2011 compared to 18.2 billion shares a year ago. Abyaar Real Estate Dev Co was the most active stock as the counter saw 2.28 billion shares being traded followed by National Ranges Co. The investor showed huge interest in Abyaar, as the Shariah Complaint real estate developer posted a turnaround profit of KWD 0.81 million in 9M-2011 compared to a net loss of KWD 2.88 million in 9M-2010. However, this profit was primarily due to gains of KWD 6.8 million, KWD 1.88 million and KWD 0.12 million which are of irregular nature. The first one was due an investment restructuring agreement with a lender in a bid to settle its old debt obligations, while other two were accounted primarily due to sale of investment in properties in Kuwait & Dubai respectively. On the operating front, the company has performed too poor by reporting negligible revenues in 2011.
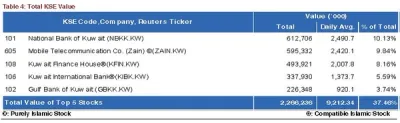
Value: The market value for the KSE stood at KWD 6.05 billion, down by 51.62% from the previous year. The downfall was largely led by market heavyweights like Banking and Service sectors. The largest sector, Banking, contributed 34.12% of total market value whereas Services sector contributed 27.2% of total market value. Though, these two sectors together shared around 61% of total market trading value, yet the former reported a drop of 31.64% in its trading value on y-o-y basis while the latter reported a notable drop of 56.49% in the year. In terms of market value sharing pattern, the market heavyweights continued to dominate the market as NBK contributed 10.13% to overall market value. It was followed by Mobile Telecom Co. (MTC) – Zain which shared 9.84% and Islamic biggie, Kuwait Finance House (KFH) stood third, by contributing 8.16% of total market value in year 2011.
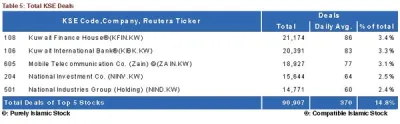
Deals: On total deals, KFIN attracted most investors to trade on, as it reported 21,174 deals in 2011, and followed by Kuwait International Bank (KIB) with 20,391 deals. Zain which occupied the top spot in 2010, displaced to 3rd as it recorded 18,927 deals in the year.
Please find attached “KSE Statistics – 2011” at the end of this report covering all the aspects of KSE listed stocks. (Appendix-1)
Oil Price Volatility and Economic Impact
Economic Lifeline – Oil; volatile under wobbly economic order
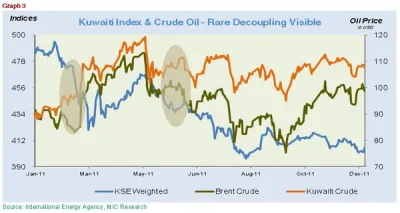
Oil prices remained highly volatile for Year 2011 amid various political and regional developments chained through the Middle East, Western Hemisphere and South Asia side. Kuwaiti Crude, a major source of Income for Kuwait, touched the peak of USD 113 per barrel in April 2011 and began its downslide to reach USD 75 per barrel by October 2011, after witnessing some quick fire sessions from the global developments. However this lower level could sustain only for a short while, as investors community remained bully on the commodity prospects despite of slowdown in the major economies. Scaling oil demand prospects, especially from China and India, played a major role for black gold and it recouped its earlier losses and crossed the USD 100 dollar mark by the end of 2011.
Graph 3, clearly depicts the oil story for 2011, as it began its journey with a steady ascend and remained rangebound between USD 83 – 97 per barrel during 1Q, and breached the USD 100 mark in February, and continued the pattern for the next quarter. In 2Q, it hovered above the USD 100 per barrel mark for most of the time, but the arrival of 3Q and news from Europe, steered a sharp correction as it touched a low of USD 79 per barrel in the period. As said before, by the end of year it recovered from a low of USD 75.4 per barrel to current price levels of USD 101.3 per barrel, facilitating a robust recovery of 34.3% recovery in 4Q-2011.
The high volatility can be easily attributed to various visible factors which made oil to ride on a roller coaster. Middle East Unrest, Japan Crisis, Euro Debt Issue, US downgrading, Geo-political tensions over Iran, Oil Supply concerns due to Libyan Crisis and slowdown of emerging markets, all together concluded in a volatile year for Oil. Certainly we can cast all these developments as incompetent for global economies, yet for Oil era they proved a boon, as exporters amassed huge surpluses in the year and bargained much higher prices from their budgeted levels. The NYMEX managed to swap an average price of USD 94.86 in Year 2011, up by 19.4% from the level seen in 2010. Surprisingly, the local Kuwaiti crude oil which trails the NYMEX, in fact fared better than NYMEX as it reported an average price of USD 105.6 per barrel during 2011 which is 38.1% gain over 2010, thus inpouring huge surplus to government coffer.
Oil – An Asset in its Class
The journey of oil remained spectacular but full of turbulence from a level of USD 30.28 on December 23, 2008 to a level of USD 79.39 on December 31, 2009, up by more than 162%, and the momentum continued in 2010 as it breached a level of USD 90 to end the year at USD 91.38/bbl. Such voyage clearly indicates that oil is not just a plain equation of supply and demand anymore; instead it has become an integral part of the hedge. Since the crisis out-busted in 2008, there has been a rapid increase in the participation of non-commercials, looking for higher returns from a rise or a fall in the oil price and/or seeking diversification of their investment portfolio. The world oil outlook (WOO) for 2011 by the Organisation of Petroleum Exporting Countries (OPEC) indicates that the growing involvement of investment banks and funds has provided opportunities to generate returns from the performance of oil derivatives (futures, options and swaps), and, as a result, oil has evolved with other commodities into an asset class. In such a case, investors found commodities more worthy and hedge towards the devaluation of currencies, which in turn helped oil to shoot up to new highs on each phase.
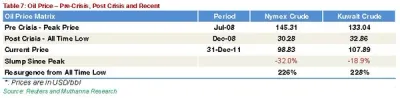
The commodity has gained 226% (NYMEX) in last three years but still around 32% lower than its all time peak of July 2008. In lieu, of increasing demand for high technologies, increasing purchasing power, limited options to replace oil as an energy generator asset and limited availability to meet the shortfall of supply gap keeps the door wide open for further gains because most of the compared assets in equities – emerging markets – have once again moved downward after touching their respective peaks in 2009 or 2010. Hence, we believe that oil remains an attractive investment destination for the global fund manager in the near term despite the economic fluctuations.
Oil Outlook – 2012
Oil Outlook, is purely defined by 3 major factors, as structured in the following diagram, as
A) Supply/demand dynamics which in turn is a function of
B) Global GDP Growth
C) the health of Gas Guzzling Nations (Like US, Europe, China, and Japan)
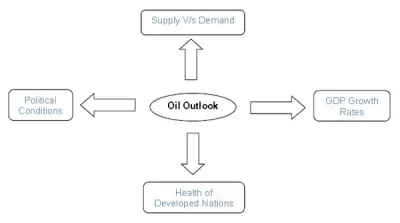
In addition to that, there are many other factors, which guides the oil price direction from time to time and remains a key factor in the oil price game, like
a) political conditions;
b) weather conditions and above all
c) commodity speculation,
which in nature, is too unpredictable but impact significantly on the crude pricing outlook, in short to medium term. As per the recent OPEC report, the oil demand reported a robust growth of 1.99% in 2011 and it is forecasted to jump further by 1.19% in 2012. With this jump, total consumption is expected to reach 88.85 million b/d from an average level of 87.80 million b/d in 2011. However, despite this growth, Year 2012 oil demand remained quite weak, if compared to last so many years and it can be certainly blamed upon an overall decline in the global GDP growth. The GDP forecast for 2011 was revised downward to 3.6% from 3.9% previously, and is estimated to remain unchanged for 2012 for the time being amid various unwelcome developments across the globe, specially the deteriorating financial stability of developed nations (Europe; US & Japan) and unstable political conditions prevailing in the MENA region. Bearing in mind the above parameters, we at Muthanna believe that the crude outlook for 2012 has a potential downside risk despite the current healthy trading level of USD 100 per barrel.
Oil Demand in 2012
Global Oil Demand will continue its upward track in 2012, as the overall consumption is expected to increase by 1.19%, yet it will remain far lower than 1.99% growth, actually reported in 2011. The growth lead will mainly be steered by developing category, due to its favorable economic growth constraints and it will be further buoyed by hefty growth in China and Russia consumption pattern. On the contrary, the OECD group, which constitutes 52.25% of the total world oil demand, is likely to witness a decline in demand as shown in table 7. The OECD nations which include economies from the troubled euro-zone and other developing nations like Japan; US and the UK, are likely to witness a dip of 0.15% in oil-demand due to their frail fiscal conditions. In this region, Western Europe will remain a key puller as it is forecasted to consume 1.04% less oil in 2012, whereas North America and OECD pacific will almost sustain their previous year quota. Among the developing category, which is estimated to guzzle 2.14% more oil over 2011, Latin America leads the pack with a high growth of 2.83% whereas the Middle East is expected to consume 2.41% more oil in 2012. The Asian giant, China, buoying upon healthy economic developments, is estimated to drain 4.58% more oil from a year ago.
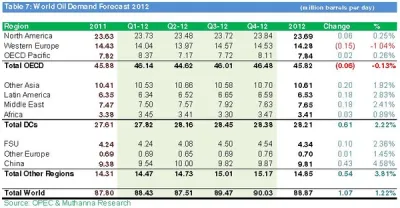
OECD: Organisation for Economic Co-Operation & Development; DC: Developing Countries; FSU: Former Soviet Union
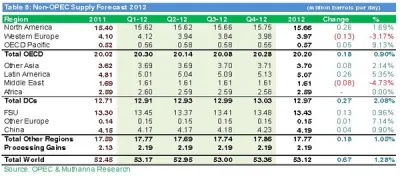
Oil Supply in 2012
On the supply side, the growth is poised to touch a mark of 1.28%, equivalent to 0.67 million b/d increase over 2011 for the Non-OPEC members. Total OECD, which constitutes around 38% of total world oil supply, is expected to report a supply growth of 0.90% in 2012, and in that too North America, which shares the biggest portion of about 78% supply, is forecast to register a 1.69% growth in its basket. The FSU, second biggest OECD member in terms of supply, will share 25.3% of the supply pie and is likely to grow by 0.96% in ‘12. The Latin America region, sharing 9.1% of the Non-OPEC supply is likely to add 0.26 million b/d in its production line, largely due to major oil findings in Brazil’s Santos Basin in the year 2011.
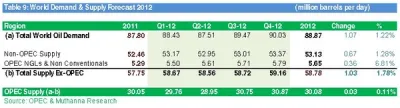
On the Supply & Demand balancing scale, as shown in the table below; total world demand is going to see a jump of around 1.07 million b/d which is largely catered by 0.67 million b/d supply increase from Non-OPEC category; while OPEC NGLs and Non conventional are to balance the remaining gap of demand, meaning the former will almost cater 65% of growing supply while remaining 35% will be sourced by the latter. On the OPEC part, the supply will average around 30.08 million b/d, registering a meager growth of 0.11% over 2011. However, in case, the situation in the region worsens, specially affiliated to Iran, the overall balance-supply equation is bound to change significantly and may prove adverse for both the trading partners (importers and exporters). The OPEC shares around 40% of total global supply and will remain in a similar circle for 2012 too.
In a nutshell: Though economic GDP is about to convert a slow growth in oil demand for Year 2012, yet we believe that supply constraints along with Iran issue in the Middle East, will continue to fetch an amicable price for this black gold. OPEC members will sustain to average their share in total supply, like in 2011, and will endure to produce around 30 million barrel per day, as per OPEC report. Moreover, the commodity will stay-in “focus” for fund managers, given the fact that world key producers are still unable to find new oil discoveries and also, they are in a think-mode to implement their new oil-projects with latest technology. Along with these two key factors, any growth in oil demand by virtue of improving outlook of developed or emerging nations, will further push up the prices and turn the equation in favors of funds managers, holding oil as an asset class in their portfolios. However, we also cannot deny the possibilities of jerky economic slowdown in Europe given the debt complexity issue and in the US it is all about unemployment and slowing consumer spending. On the contrary, the Asian economies are struggling to contain inflation in a bid to boost their GDP numbers, which is another case of negativity for the oil outlook. Looking forward, we believe under these type of circumstances, the oil will sustain its price level of around USD 100/bbl, which is certainly in line to oil exporters’ expectations.
Kuwait Economy in 2011 and 2012 Outlook
Kuwait Economy in 2011 and Outlook for 2012
Apparently the first half of 2011 was quite optimistic in terms of GDP growth for Kuwait and GCC in total. The GDP growth rate across the GCC was quite extraordinary as oil prices continued their upward trend during the year. The economic pulse rate, which touched its historical low of 0.3% in 2009, (post 2008 crisis and during an era of USD 30 per barrel) catapulted in 2010 to touch 5.4% and maintained its impetus in 2011, as the region is expected to clock-in a growth rate of 7.2% in 2011, mainly bullied by oil prices and significant growth in Qatar’s GDP. The NYMEX prices rose by 28% during 2010 and 19% during 2011 on the back of strong demand of energy products. Kuwait, in 2011, maintained the momentum of its GDP growth, as it is likely to record a GDP of 5.7% as per IMF forecast; while some individual economists and monitoring institutions have revised respective growth rate to 6%; which is again based upon higher oil prices, which hovered above the USD 100 mark for most part of the year. In first nine months of 2011, amid the price fluctuations varying from USD 95.00 p/bbl (lower range) to USD 119.33 (higher range), the average price for Kuwaiti Crude stood at around USD 107.81 per bbl; as calculated by MIC. The average price is much higher than the hypothetical budget price of USD 60 per bbl, which was tabled in the parliament for year 2011-12. In terms of production quota, Kuwait increased its oil output to fill the gap left by a halt to Libyan production earlier in the year, which also helped the tiny state to sell its oil wealth at higher prices than previous years. Increased OPEC quota and high prices, both helped favor Kuwait to garner higher revenues, in contrast to what was projected as deficit for fiscal year 2011-12.
Assuming if the similar price trend remains on track for next 3 months (January to March 2012) and OPEC member states do not comply to reduce the production, together these two factors will fill the state coffer with a surmounting budget surplus despite of planned expenditure outlay for economy as well as accounting extra expenditure which government aimed for social benefits. (Including KWD 1000 grant per person and food subsidies for 18 months).
The GDP forecast for Kuwait says it is likely to report a 4.5% growth in GDP in 2012. Though, we are quite optimistic on the oil outlook front and do not see any steep downward spiral amid supply-demand equation, yet we cannot deny that any “downward revision of global GDP” may infuse downside risk on the oil prices, in future. Depressing world economic growth rates (China the major consumer of oil is slowing down); debt crisis across the developed nations (sovereign default risk across the euro-zone; US political impasse reduction plans of rising debt); political transitions across major economies and North Africa (elections in US; France; Taiwan; China; South Korea etc) may argue for possible policy changes, which may stimulate strong headwinds for year 2012.
In concluding remarks, we at MIC believe that the economic outlook of Kuwait looks promising and it will continue to reap better oil prices, despite some slowdown in world economic outlook. We further, believe that recent legislations, aimed to encourage private sector investments in the economy, will certainly turn fruitful gradually in coming few years. Although, Year 2011 was full of political grappling, which adversely impacted the economy, yet we believe both public and private investment to pick up more distinctly in 2012.
However, in lieu of new elections in February 2012, we cannot ignore that bureaucratic issues within government and ongoing tensions between the government and parliament, may resurface, if the election outcome simply mirrors the last parliament, which will again, hamper the decision-making and disbursement capacity of the state. Import growth is forecast to rebound strongly in 2012-16 owing to increased capital investment by the government and the private sector, in particular spending on large infrastructure and oil-related projects. The non-oil sector is projected to remain relatively small, despite efforts to diversify the economy. As far as market is concerned, we believe new CMA rules will reward small investors and will surely bring transparency at all levels, which in turn will convert to high trading in market, benefitting dealers and brokers too. From an investor standpoint, we advice all our readers, to keep a close monitoring on strong operational companies, which may become new market leaders in 2012.
Prepared by:
Shoyeb Ali Vice President, sali@mic.com.kw
Nadeem Parkar Senior Financial Analyst, nparkar@mic.com.kw
For further enquiries, kindly contact us at:
Muthanna Investment Research
Safat Square, Baitak Tower, 32nd Floor, Kuwait
Tel: +965 2298 7000
mail: irdept@mic.com.kw