Search
00
GBAF Logo
trophy
Top StoriesInterviewsBusinessFinanceBankingTechnologyInvestingTradingVideosAwardsMagazinesHeadlinesTrends

Subscribe to our newsletter

Get the latest news and updates from our team.

Global Banking & Finance Review®

Global Banking & Finance Review® - Subscribe to our newsletter

Company

    GBAF Logo
    • About Us
    • Advertising and Sponsorship
    • Profile & Readership
    • Contact Us
    • Latest News
    • Privacy & Cookies Policies
    • Terms of Use
    • Advertising Terms
    • Issue 81
    • Issue 80
    • Issue 79
    • Issue 78
    • Issue 77
    • Issue 76
    • Issue 75
    • Issue 74
    • Issue 73
    • Issue 72
    • Issue 71
    • Issue 70
    • View All
    • About the Awards
    • Awards Timetable
    • Awards Winners
    • Submit Nominations
    • Testimonials
    • Media Room
    • FAQ
    • Asset Management Awards
    • Brand of the Year Awards
    • Business Awards
    • Cash Management Banking Awards
    • Banking Technology Awards
    • CEO Awards
    • Customer Service Awards
    • CSR Awards
    • Deal of the Year Awards
    • Corporate Governance Awards
    • Corporate Banking Awards
    • Digital Transformation Awards
    • Fintech Awards
    • Education & Training Awards
    • ESG & Sustainability Awards
    • ESG Awards
    • Forex Banking Awards
    • Innovation Awards
    • Insurance & Takaful Awards
    • Investment Banking Awards
    • Investor Relations Awards
    • Leadership Awards
    • Islamic Banking Awards
    • Real Estate Awards
    • Project Finance Awards
    • Process & Product Awards
    • Telecommunication Awards
    • HR & Recruitment Awards
    • Trade Finance Awards
    • The Next 100 Global Awards
    • Wealth Management Awards
    • Travel Awards
    • Years of Excellence Awards
    • Publishing Principles
    • Ownership & Funding
    • Corrections Policy
    • Editorial Code of Ethics
    • Diversity & Inclusion Policy
    • Fact Checking Policy
    Original content: Global Banking and Finance Review - https://www.globalbankingandfinance.com

    A global financial intelligence and recognition platform delivering authoritative insights, data-driven analysis, and institutional benchmarking across Banking, Capital Markets, Investment, Technology, and Financial Infrastructure.

    Copyright © 2010-2026 - All Rights Reserved. | Sitemap | Tags

    Editorial & Advertiser disclosure

    Global Banking & Finance Review® is an online platform offering news, analysis, and opinion on the latest trends, developments, and innovations in the banking and finance industry worldwide. The platform covers a diverse range of topics, including banking, insurance, investment, wealth management, fintech, and regulatory issues. The website publishes news, press releases, opinion and advertorials on various financial organizations, products and services which are commissioned from various Companies, Organizations, PR agencies, Bloggers etc. These commissioned articles are commercial in nature. This is not to be considered as financial advice and should be considered only for information purposes. It does not reflect the views or opinion of our website and is not to be considered an endorsement or a recommendation. We cannot guarantee the accuracy or applicability of any information provided with respect to your individual or personal circumstances. Please seek Professional advice from a qualified professional before making any financial decisions. We link to various third-party websites, affiliate sales networks, and to our advertising partners websites. When you view or click on certain links available on our articles, our partners may compensate us for displaying the content to you or make a purchase or fill a form. This will not incur any additional charges to you. To make things simpler for you to identity or distinguish advertised or sponsored articles or links, you may consider all articles or links hosted on our site as a commercial article placement. We will not be responsible for any loss you may suffer as a result of any omission or inaccuracy on the website.

    1. Home
    2. >Trading
    3. >FOREX CHARTING THE EASY WAY
    Trading

    Forex Charting the Easy Way

    Published by Gbaf News

    Posted on June 27, 2014

    6 min read

    Last updated: January 22, 2026

    Add as preferred source on Google
    An informative Forex chart illustrating historical price movements and trends, aiding traders in technical analysis. This image relates to the article on simplifying Forex charting techniques.
    Forex chart displaying trends and price movements for trading analysis - Global Banking & Finance Review
    Why waste money on news and opinion when you can access them for free?

    Take advantage of our newsletter subscription and stay informed on the go!

    Subscribe

    Traders have deployed various methods over the years to help them predict the movement of financial instruments. Forex charts are a very useful trading tool that facilitates individuals to conduct technical analysis, as well as fundamental analysis with great success. Charting tools enable traders to view historical data on price movements, pinpoint trends and identify key price points to enter and exit a trade.

    On this article, we look at the Forex charts essentials, so we can read the various types of charts and identify trend lines.

    What is a Forex chart?

    A Forex chart is a graphical depiction of historical market moves within a given timeframe. There are various types of charts available for traders to use. Their aim is to assist traders to form a market overview, provide for better forecasting and spot the market’s patterns and behaviour.

    Forex charts are beneficial for both technical and fundamental traders. The technical trader concentrates on the actual advent of events by reading common chart patterns, whereas the fundamental trader attempts to analyse the association between trends detectable on the chart and macro events, such as interest rates, inflation, employment, economic growth and political risk.

    Which are the most important types of charts?

    • Line Chart

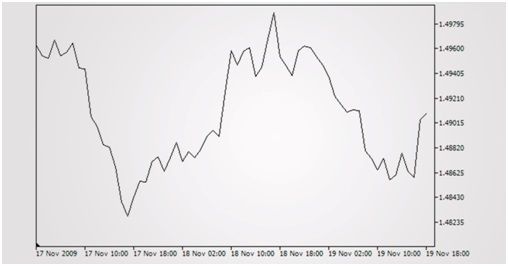
    A line chart is the most basic type of chart used in Forex. It is formed by connecting the points, representing the closing rates of the instrument, over a time frame together with a homogeneous line. This form of chart offers the simplest way to chart the resistance and support levels. A line chart can give a trader a fairly good idea of where the price of a financial instrument has travelled over an interval of time, as it provides a panoramic overview of the overall trend. As the closing prices are frequently seen as the most significant ones to keep track of, it is not hard to see why line charts have become so widely-used.

    • Bar Chart

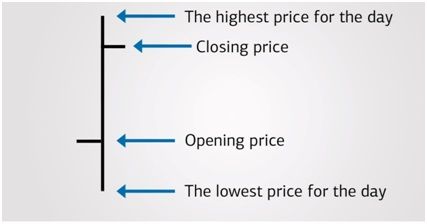
    A bar chart is highly popular among the Forex world. In addition to the closing rate, each bar indicates the opening rate, as well as the high and low of the session in order to see the strength of a movement. The bar chart is formulated by a series of vertical lines that represent each data point. The top of the vertical line shows the highest price an instrument traded at during the day, while the bottom line indicates the lowest price. The closing and opening prices are represented on the vertical line by two horizontal dashes. The opening price is displayed with the dash on the left side of the vertical line, while the closing price is represented with the dash on the right side.

    In general, if the left dash (opening price) is lower than the right dash (closing price), then the bar will be shaded black, indicating an up period for the instrument, meaning that it has gained value. Conversely, when the right dash (closing) is lower than the left dash (opening), it marks that the asset has fallen in value over that period. When looking at a daily chart/15 minute chart, each bar indicates one day/15 minute period of trading activity. This visual depiction of price activity over a certain timeframe provides detailed information of the price movement and it is used to pinpoint trends and patterns.

    • Candlestick Chart

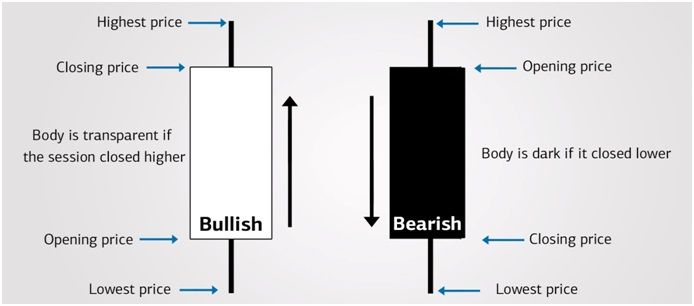
    Candlestick charts have been used for around 300 years and present a wealth of information over a small amount of time. Similar to the bar chart, the candlestick chart represents the opening, closing, high and low prices of an instrument for a selected time period. The wide part of the candle is called the “real body” and it shows the range between the opening and closing prices of the period’s trading. A transparent body dictates that the session closed higher than the open price (bullish). A filled in body means that the session closed below the open price (bearish).

    Just above and below the real body are the “shadows”. Traders think of them as the wicks of the candle and they indicate the day’s high and low. When the upper shadow on a bearish day is short it means that the opening price was closer to the high of the day. A short upper shadow on a bullish day means that the closing price was near the high. The shapes of the candlesticks differ according to the relationship between the day’s high, low, opening and closing rates.

    Candlestick charts are used to identify when to enter and exit a trade. By viewing a series of candlesticks, you are also able to see another crucial concept of charting: the trend.

    What is a trend?

     A trend is the main direction in which a financial instrument is headed towards. Usually, prices trend in a sequence of progressively moving highs and lows. There are three types of trends; uptrend (bull market), downtrend (bear market) or sideways (range bound market). An uptrend is a sequence of rising high and low points, a downtrend is a sequence of declining low and high points, while sideways trend arises when there is negligible shift up or down.

    In conjunction with the three types of trends, there are also three trend lengths that relate with the time interval in which the trend occurs. A term of any trend can be categorised as long-term, intermediate or short-term. A long-term trend consists of various intermediate trends, while short-term trends form intermediate and long-term trends.

    Trend lines are used to assist traders to visually acknowledge which trend direction is in place. Until the trend is broken, traders can logically anticipate the trend to continue. Trend lines can also be used in identifying trend reversals. A trend reversal occurs when each successive high or low falls below or climbs above the previous point of the trend.

    Drawing a trend line is simply drawing a straight line that connects two or more extreme highs or lows that follow the generic trend. An upward trend line connects the low points of an upward trend. This will indicate the support level where the price tends to find support as it is moving down. This means that the price is likely to bounce off this level rather than break through it. A downward trend line, on the other hand, connects the high points of a downward trend. This will dictate where the price tends to find resistance as it is going up. Similarly, this means that the price is more likely to bounce off this level, rather than break through it.

    Fig. 4 Upward Trend Line – Support Level                            Fig. 5 Downward Trend Line – Resistance Level

     It is imperative that you know how to read charts and identify trends in order to form a successful Forex trading strategy and consistently profit in financial markets.

    More from Trading

    Explore more articles in the Trading category

    Image for SV-Alan.com Highlights Growing Demand for Trading Platforms Amid Market Volatility
    SV-Alan.com Highlights Growing Demand for Trading Platforms Amid Market Volatility
    Image for Brokerage brand Octa changing ownership: Main highlights
    Brokerage Brand Octa Changing Ownership: Main Highlights
    Image for Nominations Open for Best Multi-Asset Trading Platform South Africa 2026
    Nominations Open for Best Multi-Asset Trading Platform South Africa 2026
    Image for Ziraat Yatırım Menkul Değerler Anonim Şirketi Secures Dual Honors at the 2026 Global Banking & Finance Review Awards®
    Ziraat Yatırım Menkul Değerler Anonim Şirketi Secures Dual Honors at the 2026 Global Banking & Finance Review Awards®
    Image for VPS Securities J.S.C Wins IPO of the Year Vietnam 2026 at the Global Banking & Finance Review Awards®
    Vps Securities J.S.C Wins IPO of the Year Vietnam 2026 at the Global Banking & Finance Review Awards®
    Image for Understand What Is Whipsaw in Trading and How You Can Avoid It?
    Understand What Is Whipsaw in Trading and How You Can Avoid It?
    Image for Committee of SADC Stock Exchanges Wins Best ESG Initiative - Framework for Sustainability & Equality Reporting Africa 2026 by Global Banking & Finance Review®
    Committee of Sadc Stock Exchanges Wins Best ESG Initiative - Framework for Sustainability & Equality Reporting Africa 2026 by Global Banking & Finance Review®
    Image for BIDV Securities Company (BSC) and Mr. Lê Huy Honoured at the 2026 Global Banking & Finance Review Awards®
    Bidv Securities Company (bsc) and Mr. Lê Huy Honoured at the 2026 Global Banking & Finance Review Awards®
    Image for Bao Minh Securities Wins Best Investment Research Vietnam 2026 Award by Global Banking & Finance Review®
    Bao Minh Securities Wins Best Investment Research Vietnam 2026 Award by Global Banking & Finance Review®
    Image for Allianz Trade Wins Best Trade Credit Insurance Company Asia Pacific 2026 at the Global Banking & Finance Review Awards®
    Allianz Trade Wins Best Trade Credit Insurance Company Asia Pacific 2026 at the Global Banking & Finance Review Awards®
    Image for OCBC Securities Pte Ltd Celebrates Major Wins at the 2026 Global Banking & Finance Review Awards®
    Ocbc Securities Pte Ltd Celebrates Major Wins at the 2026 Global Banking & Finance Review Awards®
    Image for Maybank Securities Singapore Triumphs at the 2026 Global Banking & Finance Review Awards®
    Maybank Securities Singapore Triumphs at the 2026 Global Banking & Finance Review Awards®
    View All Trading Posts
    Previous Trading PostCopy Your Way to Forex Success
    Next Trading PostUnderstanding the Currency Outcomes for an Independent Scotland