New Zealand Trade Data Surges in February
Earlier in Asian session, New Zealand’s imports, exports and trade balance data was published by the Statistics New Zealand. The report suggested that total goods exports rose in February 2014. This boosted New Zealand dollar against most of the counterparts, including the Australian dollar, as AUDNZD moved lower after the release.
Release details
 The trade balance registered highest-ever trade surplus ($818 million) for any February month, and the value of exported goods rose $663 million with goods exported to China rising to $388 million. The labour statistics manager Louise Holmes-Oliver mentioned in the report that “the rise in dairy this month was supported by logs and meat, with much of the increase in these commodities destined for China”. The outcome exceeded the expectation by a fair margin, which is helping the New Zealand dollar to gain strength Intraday.
AUDNZD Tests Key Fibonacci Level
AUDNZD is set to register a major failure at around 50.0% Fibonacci retracement level of the last major bear leg from the 1.0940 top to 1.0530 low. This level also coincides with a major trend line, which has acted as a resistance numerous times. However, the pair is approaching a critical channel support zone where buyers are expected to return. If the pair pushes one more time higher and succeeds in piercing the bearish trend line, then a move towards the 61.8% Fib retracement level is possible in the short term.
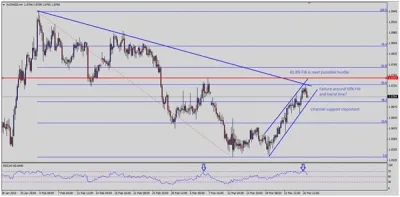
Potential Downside Risks for AUDNZD
Any further downside acceleration, and break of the channel support region could open the doors for a move back towards 1.0600 support zone. There is a minor divergence noted on the RSI between the last two highs (1.0760 and 1.0740), which paints a mixed scenario on 4 hour timeframe. Considering that NZDUSD is reaching critical resistance levels and AUDUSD has more room on the upside, one can anticipate swing moves in AUDNZD in the sessions ahead.
Prepared by Aayush Jindal, Chief Technical Strategist at Capital Trust Markets
To keep yourself updated with the latest financial news, visit the official website of Capital Trust Markets
About Capital Trust Markets Brokerage
Capital Trust Markets is an online Forex brokerage firm, headquartered in New Zealand. It was established in 2013, with an emphasis on providing the most excellent customer services in the industry. The trading environment offered to investors and traders is unparalleled – devoid of all common mistakes usually prevalent in the financial trading industry. The focused determination to provide the highest quality products, services, and support to clients and customers is what truly sets Capital Trust Markets apart from every other major brokerage firm.